It has been a while I have used the OneDrive Windows 10 app, and since that time to my amazement it has been updated with some features to bring it at par with some of the functionalities available with the OneDrive Web App.
Something which I like with OneDrive in particular is that it writes the captions and tags back to the photo metadata, which is something important for many archivists. Other online services do not tie nor allow an easy way to export this information easily. For example, you can export the file metadata from Google Photos as a separate file using Google Takeout, and Flickr provides a similar functionality. Still, after exporting your photos and metadata, writing this information to the image file is not so easy. So OneDrive clearly has an advantage for this type task as it could tie in nearly seamlessly with your photo management workflow have on your PC.
Integrating with your Photo Management Workflow
Photos stored in OneDrive can be synced back to your PC along with the captions and tags and can be read and edited using your preferred photo management application. It is worth it to understand how the captions and tags are read and written to in each application to avoid any conflicts or out of sync metadata, as even though applications may follow common standards their behavior can vary. OneDrive seems to follow the same behavior as in Windows Photo Gallery which I discussed in my post entitled Accessing Windows Photo Gallery Metadata using Exiftool.
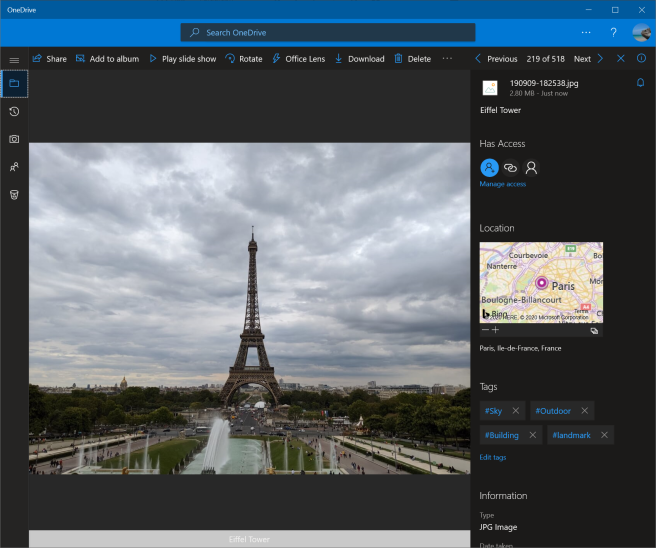
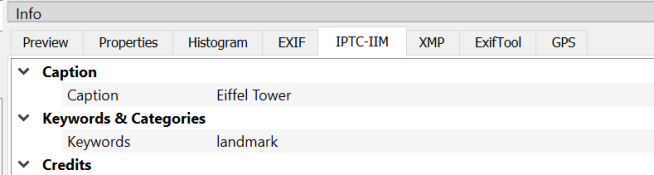
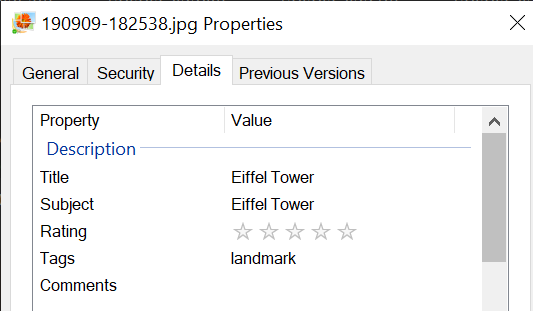
XNView Info Pane displays Caption and Tags added in OneDrive. This is because the information is saved back to the file metadata and available to those applications which support them.Windows File Explorer Properties display the OneDrive caption in the Title and Subject fields.
OneDrive Auto Tags
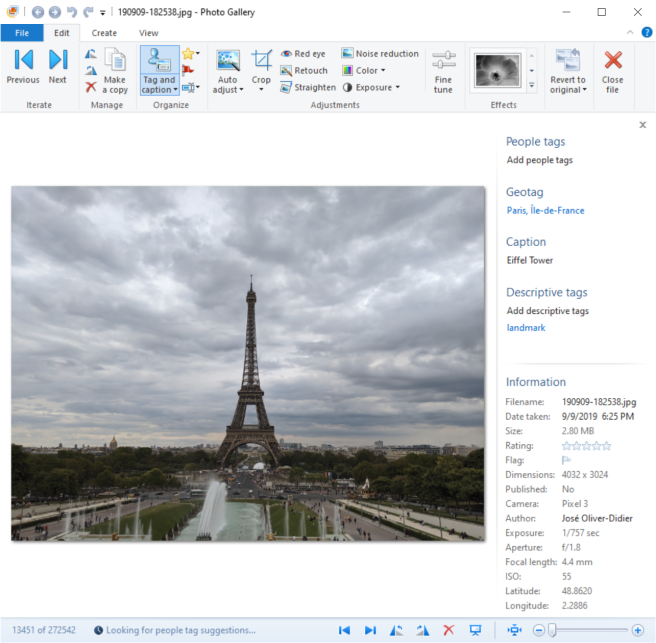
OneDrive also has auto tags, which are tags added using Microsoft’s computer vision services. These tags are not written to the file, just displayed. In the screenshot provided, OneDrive tagged the image with “Sky”, “Outdoor” and “Building”. I added the “landmark” tag manually. Any tag added by the user however, will be written back to the file. Flickr has a similar feature, but differentiates between the automatically added tags with the user added ones by changing the tag appearance, which in my opinion is a better design. If you wish to write the tags back to the file, I wrote about a workaround in the post – Saving OneDrive Photo Auto Tags to the file metadata.
Windows Photo Gallery displays captions and tags added using OneDrive.
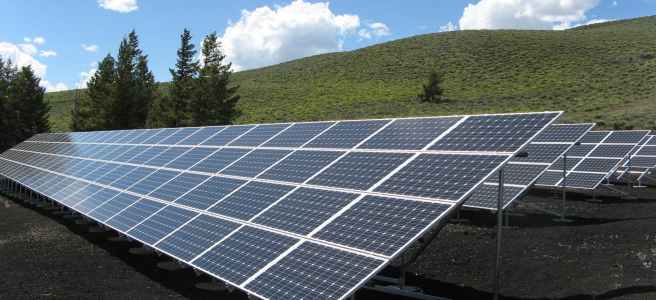
Con los aumentos esperados en las tarifas de energía decidimos hace un tiempo en instalar un sistema fotovoltaico (PV) en nuestra residencia, uniéndose a los mas de 16,000 residencias con sistemas fotovoltaicos en Puerto Rico. La instalación del equipo fue relativamente sencilla. No tan sencillo fue el proceso burocrático para interconexión con la Autoridad de Energía Electrica (AEE), pero eso es otro tema. En fin se logro activar la facturación de medición neta.
Hay varias maneras en que se puede configurar el sistema PV en un hogar. Puede ser una combinación con baterias y/o con medición neta. En nuestro caso y luego de un analisis, optamos por solo medición neta. En esta configuración el exceso de energía es “exportado” a la AEE, el cual lo acredita en la factura. Este credito, es utilizado en momentos donde el PV no esta produciendo energía, como es en la noche.
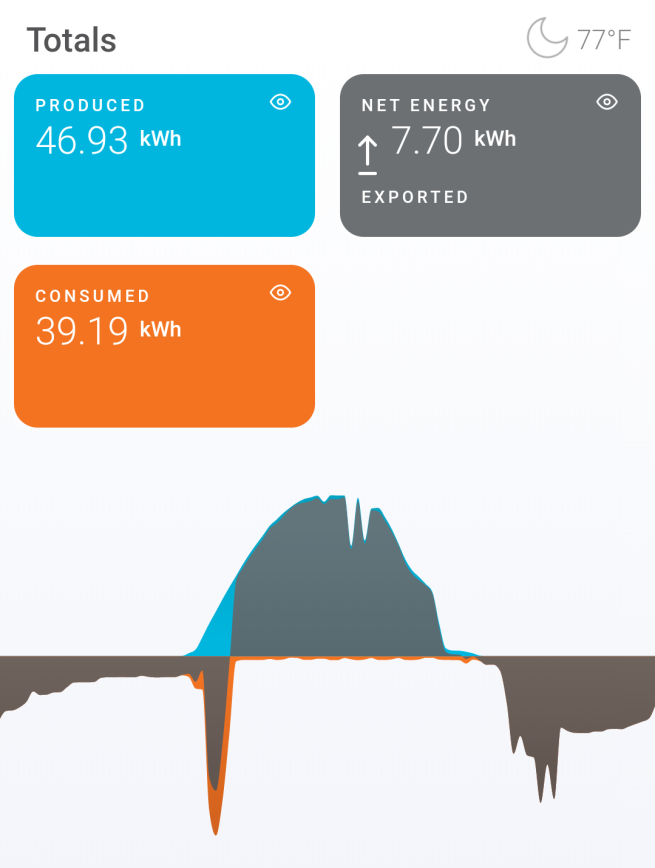
Esto se puede visualizar mejor con esta toma de pantalla de la aplicación de monitoreo muestra un dia típico en el cual no hay consumo durante el dia debido a que estamos en nuestro lugar de trabajo pero el sistema PV produce y exporta energia a la AEE. En la medición para ese dia, el consumo neto fue -7.70 kWh, es decir la AEE recibio mas energia que la consumida.
Azul: Energia producida. | Anaranjado: Energia consumida. | Gris: Consumo Neto
La AEE se benefician de distintas maneras como:
El costo del equipo lo asume el consumidor. La AEE no tiene que invertir en compra de las placas solares ni en la construcción de plantas de generación.
La AEE no tiene que invertir recursos o combustible en la energia que recibe del PV de consumidor. Esto es importante, debido a que cuando el sol esta brillando son los momentos “pico” de consumo de energia y la AEE a veces recurre a combustibles mas caros como el diesel para satisfacer la demanda. La energía que recibe de los PV es “gratis” y es revendida por la AEE. Energía que se acredita al consumidor usualmente es producida por fuentes mas económicas por la noche.
Pueden ver informes actualizado del costo de energía por unidad aqui.
La generación de energía está mas cercana al punto de consumo. La transmissión de energía del punto de generación (Ej. La planta de Aguirre) al punto de consumo (Ej. Tu hogar) conlleva un gasto y perdida de energía en lo que llega a tu hogar. Puede resultar entre 5% a 8% de perdida. Mientras mas lejos estan, mas energía se pierde, por lo que hay un ahorro.
Lea: We calculated emissions due to electricity loss on the power grid
Protección del medio ambiente. Esta quizás es la mas importante, debido a que se reduce el impacto ambiental causado por la extracción, quema, transporte y almacenamiento de combustibles fósiles como el petróleo y gas natural. Esto tambien se traduce a menos riesgo de cumplimiento a la leyes ambientales a la AEE, que le ha resultado en multas a la AEE.Pueden ver el Resumen de Generacion de la AEE actualizado.
Daylight savings time started last Sunday and as when traveling across time zones, you should ensure your cameras’ clock is correctly set. Since the date and time taken is written to the file as metadata when a photo is taken it is a good thing to have this information accurate.
Also, if you want to have your photos to have their DateTime Taken values set to a high degree of precision here is a trick you can do using your smartphone’s clock, the freely available app GeoSetter, Geotag Photos (optional) and your Windows PC.
1. Check your smartphone’s clock – Your smartphone typically has a functionality to automatically set its own date and time, make sure it is on. Smartphones use their carrier’s clock which is set to a precise date and time – most likely synced to the NIST atomic clock.
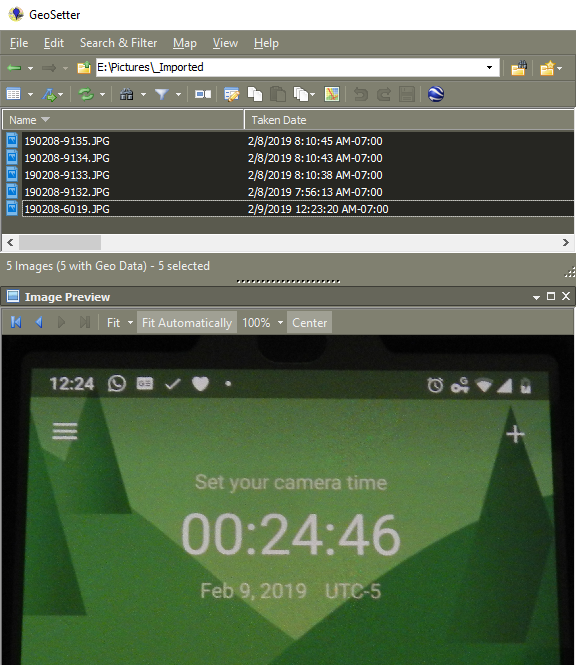
2. Using your camera, take a photo of your phone’s clock. I use the app geotag photos which displays clock down to the second for precisely setting your camera’s clock. Should be done at the geographical location where you are taking your pictures so you can record the correct time. Geotag photos has a nifty feature which alerts you when the time zone has changed.
3. Import you photos into your PC – Import your photos as you regularly do.
4. Select your photos – Open Geosetter and navigate to the folder your photos were imported to. Select the photos you which to have their time adjusted. The last photo you select should be the picture of your phones clock taken in step 1, as this will serve as the benchmark to which the selected photos will be adjusted to.
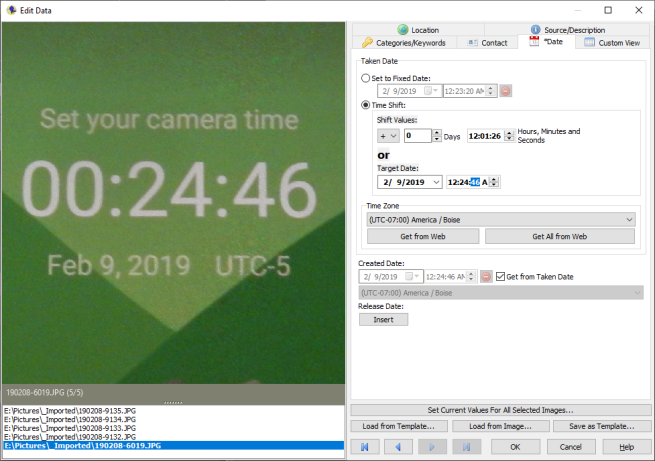
5. Time shift – In Geosetter, click to Edit the photo data from the menu bar: Edit -> Edit Data or press <Ctrl>+<E>. Check the Time Shift checkbox and set the target date as the same date and time which appears on the photo you took of your smartphone. You will need to click on the [Set Current Values For All Selected Images…] button and ensure the Date Taken is selected so that the time shift is applied to all the photos you have selected.
6. You will not that the values have changed and mark as red in GeoSetter’s main window. Click on [Save] from Geosetter’s main window and the metadata is saved back to the files.
—
For further understanding around the challenges surrounding Time Zones in computing check out this video.
For some time I have wondered it would be neat to capture ambient weather information when a photo was taken. Why? you may be wondering. Well, along with the image itself the accompanying metadata captures a lot of the moment. Basic information contained within a modern digital image file of course is the date and the time when a photo was taken. Smartphones and certain cameras can also capture the location geo coordinates using GPS or other geolocation methods. Cameras can even detect faces and even perform facial recognition identifying people in the photos. Already smartphones have pressure and temperature sensors so if the information is available why not record that information to the image metadata as well?
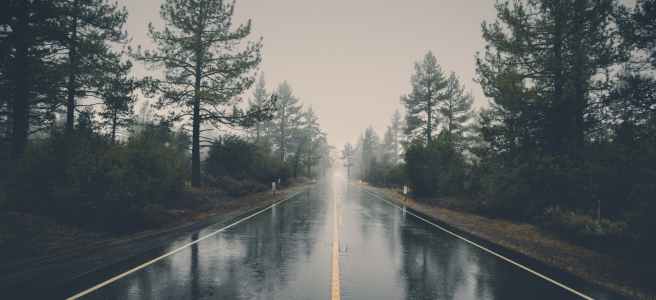
This information can be used to aid photo organization and searching in various ways. AI image analysis could also use this information in identifying and classifying images. For example, if an AI engine is almost certain that the image contains snow or rain, would not humidity and temperature values be helpful to increase its certainty? Classification of images as taken indoors or outdoors could also be aided using these values.
For cameras which lack capability, this information could also be added during post-processing. An image file with the date and time information along with geo coordinates it would be possible for a web service with historical weather station information to return this values so that they can be added back to the file. Apps such as Snapchat already do this as “stickers”. Services which contain historical weather information are: NOAA Centers for Environmental Information, Weather Underground and Open Weather Map.
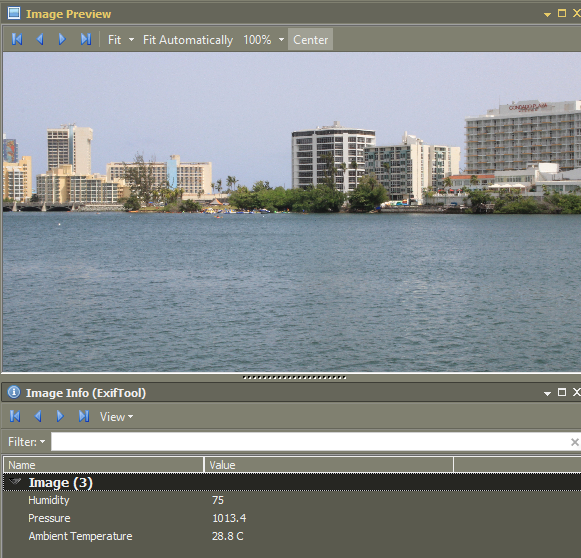
Screenshot from Geosetter displaying the weather related EXIF tags for a photo in its Image Info panel.
Weather Tag
Update 10/2018 – I wrote a simple Windows command line application for adding weather information to a set of images. Using the date and time a photo was taken, the app matches the weather reading from a file containing periodic weather readings. The project is hosted in https://github.com/josemoliver/WeatherTag
Update 4/2019 – Flickr now displays this information for recently uploaded files – here is an example. On the photo page if you click on the Show Exif link it will include Ambient Temperature, Humidity and Pressure readings, if available.
When I travel I like to keep a log of the places visited as well as ensuring my photos are adequately geotagged. I started some years ago when I got a handheld GPS to continuously log my location and then using a desktop software like GeoSetter to embed the geolocation information into my photos EXIF metadata with the GPS location the photo was taken.
Nowadays it is much easier, as my smartphone photos are automatically geocoded with GPS location information at the moment the image is taken. Still, using GeoTag Photos Pro, I keep a track of my movements for later embedding location info to the photos taken with my SLR camera which lacks GPS functionality.
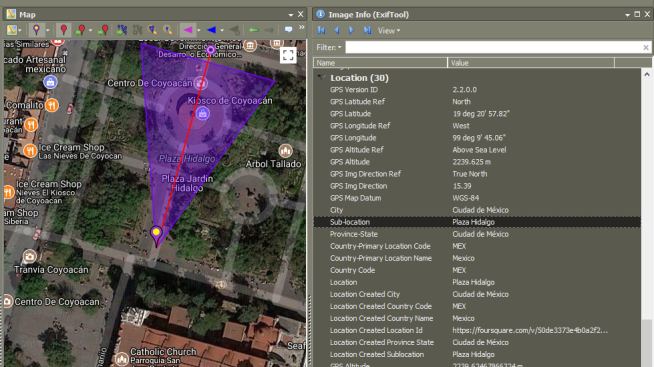
Post editing the photos at home after the trip, I added to the photo metadata the names of the places visited to the corresponding IPTC location metadata fields using the desktop app Geosetter. You can see the image metadata of an image taken on the trip here as an example.
Here is where your Foursquare check-ins come in handy, as you can use them to add missing location metadata using Geosetter.
GPS information and location names added to the embedded metadata of the image filem shown here using Geosetter. The metadata of this particular image which was taken at Plaza Hidalgo can also be seen here.
To add Foursquare Swarm Check-in Location names to your photo metadata:
1. Export your Swarm/Foursquare Checkins as a KML file – Foursquare’s Check-in Feeds page will allow you to export your Swarm checkins to a KML file. Just right click on your private kml feed link and save the file to your desktop.
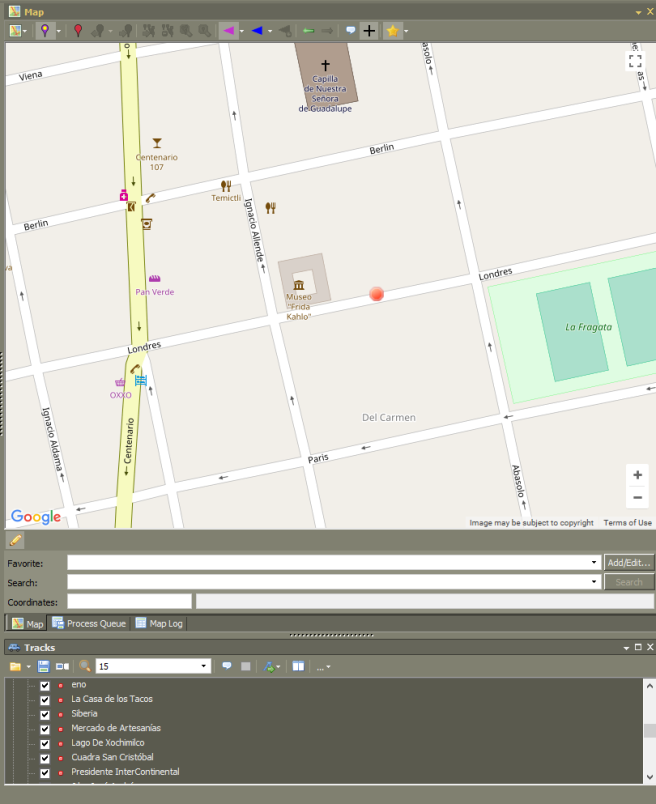
2. Load the KML file into GeoSetter as a track file – Within the GeoSetter desktop application, click on the Tracks section Open file button. If it is not available, click on View -> Tracks, to enable.
3. The dots which will appear on your map correspond to a check-in location. It may not necessarily be on the exact location but it still provides you with the place name:
Foursquare check-in history loaded in Geosetter. Check-in locations are shown as dots on the map.
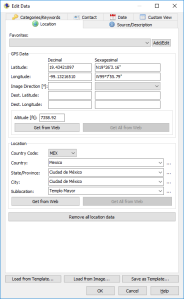
4. Select the image files you wish to add the location information and you can manually add it:
Geosetter’s Edit Data dialog box allows user to add or edit certain metadata fields for an image file.
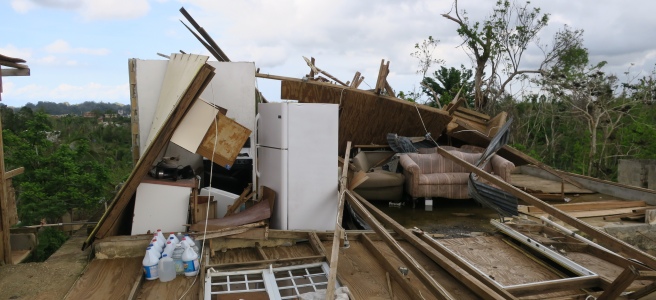
The study puts the number at around 4,600 deaths which may be attributable to the hurricanes (Irma and Maria) which damaged Puerto Rico’s infrastructure. The storms left a significant portion of the island without electricity, potable water, and communications for an extended period of time. Access to supplies and movement was hampered by landslides, damaged roads and bridges.
While there is no dispute in the sharp uptick in overall deaths in Puerto Rico in the months immediately following the storms, linking the deaths to the storm has been a contentious issue. In the days and weeks following the storm hospitals were either functioning with reduced capacity or none at all. Government resources understandably were directed to recovery efforts, so counting the dead was not a top priority. The way that the government tallies the dead does not help either as storm related deaths are counted only if they are certified as directly caused the storm – dying after getting hit by flying debris during the storm counts. Yet, an elderly diabetic person who’s insulin spoiled because of a lack of refrigeration and died because his glucose got out of whack is considered to have died of complications from diabetes. A person with a respiratory infection may have gone without early treatment because of damaged roads and died as a result of complications – died of respiratory disease not because of the storm. No communications meant no 911. Such conditions, also takes a toll on mental health, so suicide rates also increased during this period.
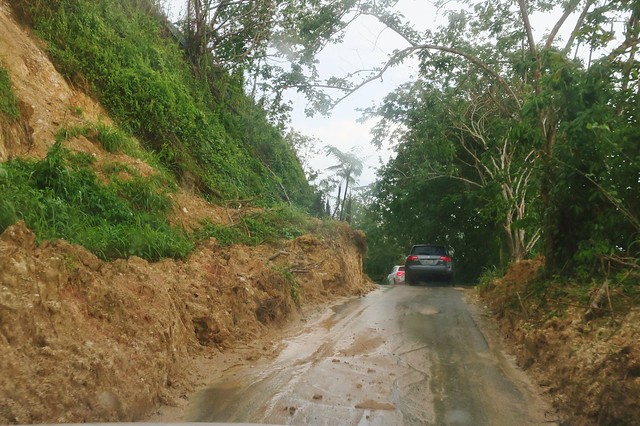
Months after the hurricane, certain roads were still susceptible to landslides and communities lacked electricity, running water and communications.
OpenStreetMap data aided this study in ways not possible only a few years ago. On a recent radio interview, Domingo Marqués, one of the study’s authors, said that without the map density data this study would not have been possible¹. Thanks to a worldwide push lead by the Humanitarian OpenStreet Maps Team and other contributors holding map-a-thons and working individually – sufficient map data for Puerto Rico was largely available by the time the study needed it. For this study in particular, OSM information was used for selecting the sample.
From the study:
Sampling buildings using OpenStreetMap
Households within barrios were identified using OpenStreetMap (OSM) layers for structures identified as “buildings”. For each randomly selected barrio, we iteratively downloaded structure information using the OSM overpass API, calculated centroids for structures identified as buildings, and randomly sampled 35 locations. We generated geospatial PDFs for each barrio level with an OSM base layer, a barrio boundary and the sampled building points. The geospatial PDFs were loaded on Samsung Tab A 7” Android devices and displayed using PDFMaps. Enumerators were trained to load maps, identify their position and navigate using these geospatial PDFs.
The study thanked OSM contributors and serves as another example to OpenStreetMap’s usefulness.
Map-a-thon’s like this one held in San Juan, Puerto Rico helped improve OpenStreetMap data
As somber as this mortality study is, it can give us hope for better responding for catastrophes in the future by understanding how these deaths occurred. Traditional hurricane preparedness centered towards seeking shelter away from areas prone to flooding. Analysis of the causes of these fatalities along with OpenStreetMap may change this thinking. A location may not be prone to flooding, but may be still vulnerable because of landslide cutting off the only access road. Medicine, Potable Water and other supplies could be pre-positioned prior to the storm’s arrival and tailored on demographic figures to better serve communities which may have a hard time evacuating. After a storm, rapid post disaster data analysis can optimize relief resources to people in need. Temporary clinics could be set quickly up after a storm in critical locations to tend people suffering from chronic diseases or respiratory disease in order to avoid any complications which could lead to death.
OpenStreetMap and the continuing contribution its volunteers in drawing and identifying buildings and other physical features will hopefully play a role in many other studies and applications in understanding this disaster and preparing for future ones worldwide.
Scanning photos taken by grandparents on a trip to Europe in 1960 is quite fascinating. Seeing the places they visited, some which I have also had the opportunity to visit as well, is a nice way to remember them. However, the photos presented a bit of a challenge- while some had handwritten captions mentioning the location they were taken, most lacked this information.
Modern digital cameras embed metadata into an image file with details such as the date/time taken and geolocation. These bits of information make it easier to know where a photo was taken. So with these analog photos- I have only a black and white image of an unknown place.
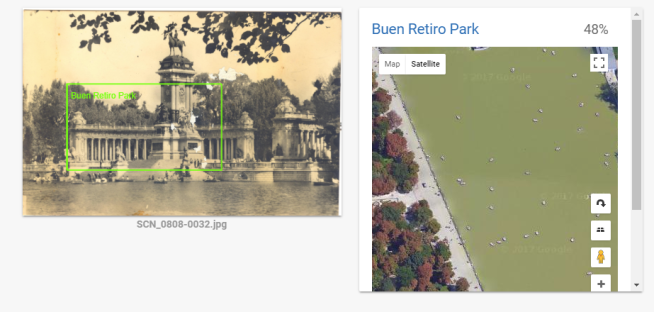
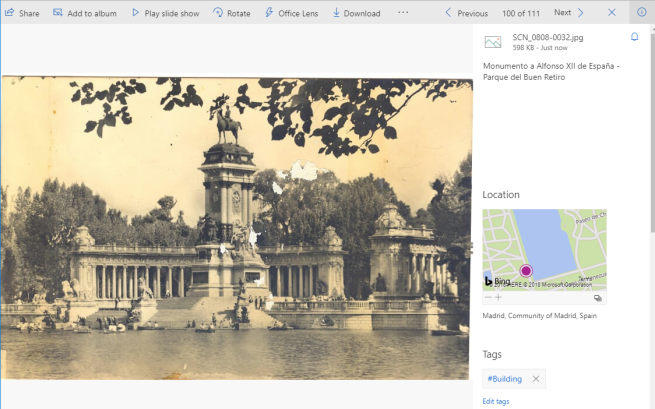
The Google Vision API provides a way of identifying landmarks from photos. In this example, the service correctly identified the photo as taken at the Buen Retiro Park in Madrid, Spain – https://cloud.google.com/vision/
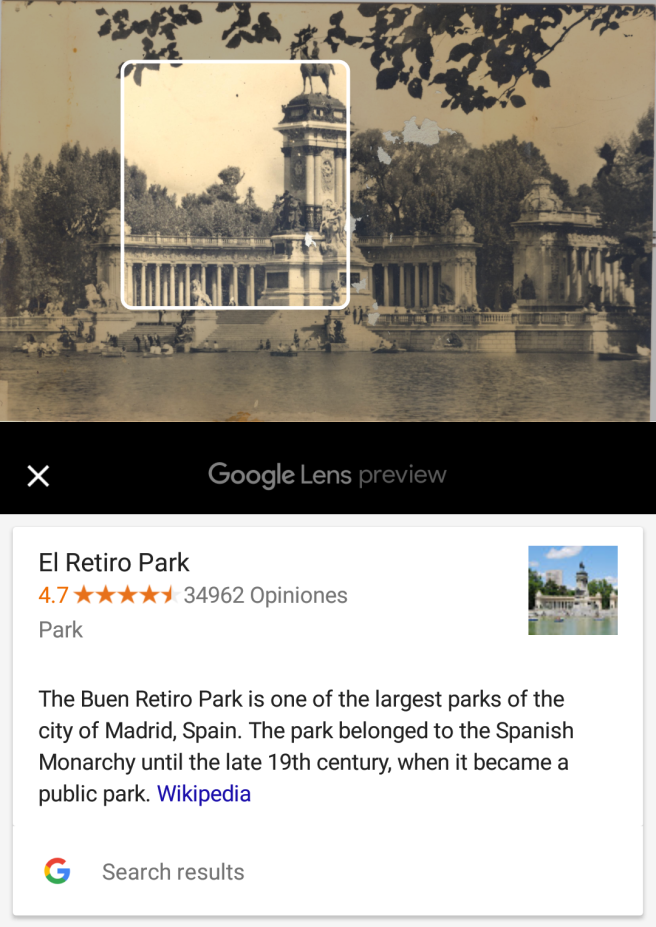
In mobile devices, Google Lens also uses this technology to recognize landmarks and present relevant information.
Google Lens uses Google Vision to identify landmarks from images.
Adding location information to the image file metadata
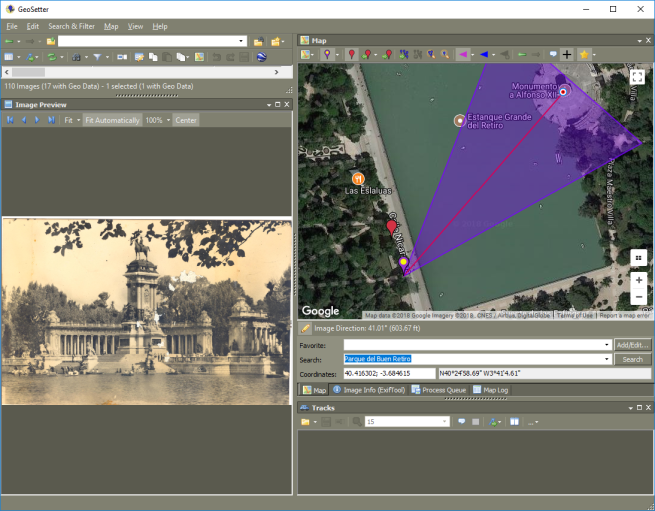
After positively identifying the landmark and geographical location where the photo was taken using Google Vision, I turn to GeoSetter for adding the missing geolocation information as well as captions to the image file metadata. Adding this information allows other applications and services to use it as well.
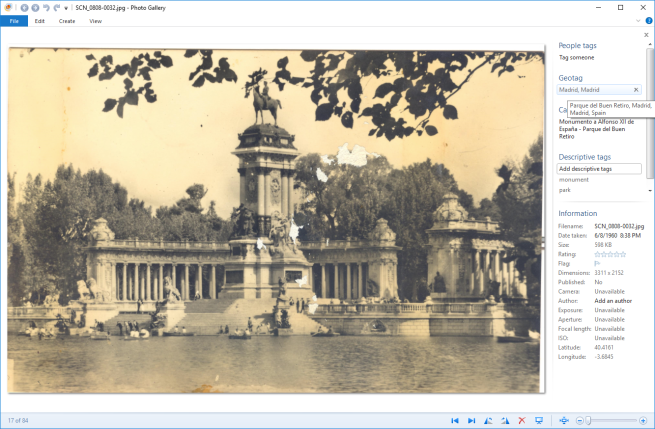
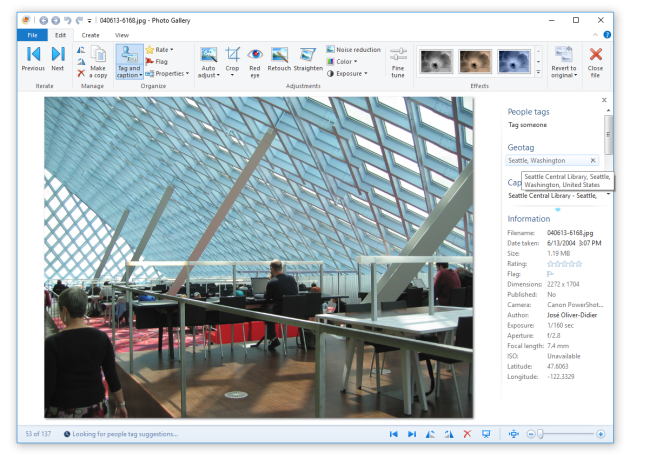
Applications or services as OneDrive can use geolocation data to display the location on a map. The caption is also displayed showing the name of the monument as it was identified with the help of Google’s Landmark Recognition engine.Geotagged photo shown in Windows Photo Gallery – the added metadata of the location taken is shown as a Geotag.
First, a quick explainer on how geotags are saved in image files and used to work in Windows Photo Gallery (WPG) – As you may know, photo files such as JPG can store additional information called metadata. The best analogy for understanding what metadata is by imagining a printed picture with written information written on the back. There are multiple ways (formats) of writing this information known as EXIF, IPTC, XMP. Think of it as paper forms with fields (such as date, time, caption, locations) to fill in, which are added to a photo.
Here is the general logic behind Windows Photo Gallery’s Geotags (in order):
1. If a photo already contains Location, City, State/Province and Country fields filled in, WPG would use the information it has to display as the Geotag. It would display the IPTC Extension fields as the first choice (if available) and the IPTC Core “legacy” fields (if available) as the second option.
2. If a photo has GPS Latitude and Longitude, but no City, State/Province, or Country information in the fields described in (1), then WPG would consult a Microsoft web service to determine the “Geotag” based on latitude and longitude, this process is called reverse geocoding. It will not however, write the “Geotag” information back to the file, unless they are edited manually by the user.
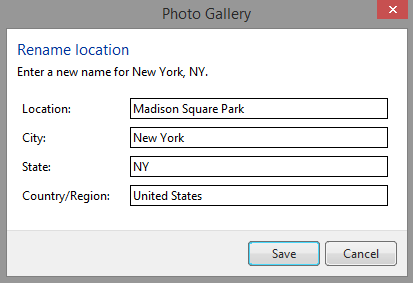
Windows Photo Gallery “Geotag” rename dialog box. When edited, the information is saved back to the file to the IPTC Extension “Location Created” fields.
Given that Microsoft decided to discontinue WPG last year, the service which determines the geotags is no longer working, so holdout users may find these fields empty or have trouble adding new geotags. Hence, exiftool, Lightroom or other photo management applications will only be able to show you geotag information if it was written within the file.
GeoSetter to the Rescue
As a workaround, I rely on a freeware application called GeoSetter (which internally uses exiftool). Geosetter uses a service from Geonames.org, in a similar fashion which WPG did, to aid in finding location info as well it allows users to edit them manually. I exclusively have been using GeoSetter for some time, which unlike WPG it will always save the information back to the photo file. GeoSetter also allows one to edit the latitude and longitude info, which I was unable to do so in WPG.
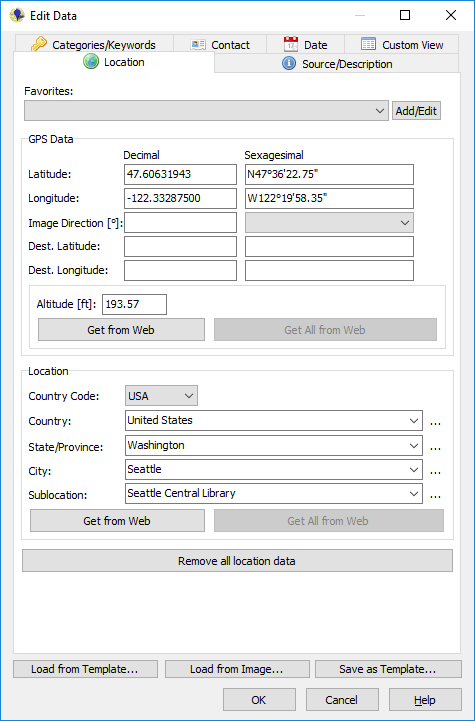
GeoSetter’s Edit Data dialog allows users to edit EXIF GPS as well as IPTC Location fields.
To make GeoSetter read any existing WPG Geotag – You will need to copy any saved “geotag” information from the IPTC Extension, to the equivalent IPTC Core fields using an exiftool command. In a previous post I described how to use exiftool for accessing Windows Photo Gallery. You will only need to run this step once on your photos from the command line. I advise you to make a backup copy of your files before executing it.
-r means that it will execute recursevly, so that all subfolder are included. -overwrite_original means that exiftool will not create a backup of the file.
Again, this will only work on file which WPG saved the geotag information to the file, otherwise the fields will be empty.
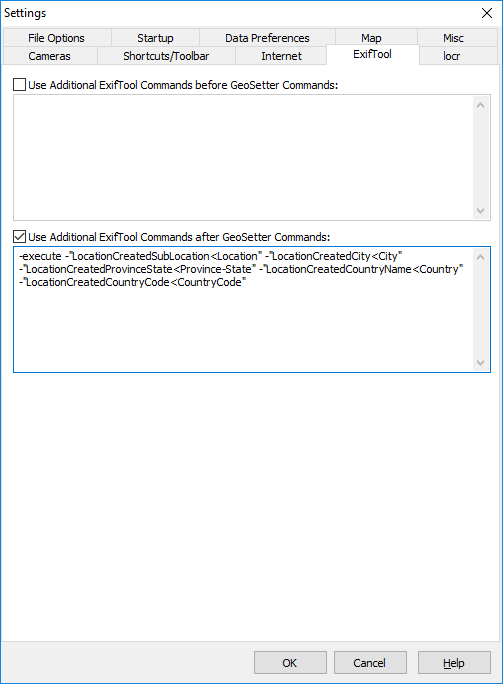
To configure GeoSetter write back information to the newer format when an edit is made– In the GeoSetter application menu, go to File | Settings. In the Settings dialog, go to the “ExifTool” tab. Ensure that the “Use Additional Exiftool Commands after GeoSetter command” checkbox is enabled and add this text to the text field underneath:
GeoSetter’s Settings dialog. Adding additional exifool commands allow custom actions such as copying field values to another. In this case location information is copied to IPTC 2008 Spec fields.
If you are still a die hard Windows Photo Gallery fan, you will find that with these tips the geotag information populated with what you was entered by GeoSetter. While the reverse geocoding capability may be gone, you can still use WPG sort by GeoTag and Search functionality as before. Still, looking forward, I would avoid editing geotags in WPG and rely instead on GeoSetter as a replacement for this functionality in order to avoid the problems previously described.
As Hurricane Maria‘s winds and rain battered our home in San Juan, among the many thoughts that bounced in my head in those long hours was wondering about the people living in the mountainous regions of the island. The winding roads, heavy foliage, cliffs, bridges and terrain susceptible to landslides could make it the worst place to be in such a storm. Many small communities on those mountains would become isolated for days.
The storm left us without power, water and cellphone service. In the following days, I managed to connect to one of the few hotspots available and got an email indicating that The Humanitarian Open Streets Maps team was responding to the disaster per the request of the Red Cross. As a local OpenStreetsMap user, I new what that meant. Yet never imagined how it would take shape and how vital that information would become to the relief efforts.
OpenStreetMaps, or OSM as the name implies, is an open and publicly available geographical database which anybody can use and edit. Think of it as the Wikipedia for maps. Governments, Non-governmental organizations and companies such as Apple, Foursquare and Yahoo use OSM. You may have seen OSM data in a map on your phone without even knowing it.
For some time I have tinkered as a contributor to OSM in my spare time. A small local group of volunteers have been able in getting some local government municipalities to contribute data to OSM. Most of it may be out of date so OSM volunteers review and even sometimes perform field work to ensure accuracy and quality. Local organizations such as Foundation for Puerto Rico have sponsored mapping activities to under-served communities. Initiatives like these have led to good PR road information in OSM. While larger cities may have good building descriptions, rural areas especially the mountain regions in Puerto Rico may have very little geographical information available.
When a major disaster strikes and a large scale response effort needs to be executed knowing where those building structures are located is essential. That’s when the Humanitarian OSM team can quickly turn the focus of mapping volunteers to analyse satellite imagery on a location in need. To my surprise, universities stateside sprang into action organizing Map-A-Thons for Puerto Rico. In these map-a-thons events, experienced OSM users recruit newbies and teach them the basics to put them to work in outlining buildings and drawing roads over satellite imagery. I even encouraged my brother who lives in NYC to attend one of the events. An avalanche of data ensued and its importance cannot be underestimated. When someone’s home is outlined on a map, it means something. It means that it exists, it is there and that a someone may live there.
I visited the Red Cross Operations Center in San Juan and witnessed something truly amazing. A flurry of activity with volunteers from around the world gathering to help our island. I had chance to talk with a Red Cross worker working the maps data and the folks responsible for prioritizing the relief efforts. In such a situation, it only beckons a human being to ask “How can I help?”, which I did. I was told the Red Cross was printing large format maps elsewhere and they needed that capability there. I quickly contacted some friends which where able to get them a large format printer to the ops center. As best as I could contacted the local OSM volunteers and GIS professionals, which could aide the Red Cross.
Red Cross volunteers in San Juan, PR hold up a map of Puerto Rico
The Red Cross is providing disaster relief right now, as well as employing highly capable geographical information systems (GIS) tools with volunteers on the field to catalog which roads are accessible or obstructed. That obstruction could be a landslide, fallen trees or a collapsed bridge. The information is shared with FEMA and local agencies which in instances in coordination with the military determine the course of action for rendering aid.
Disaster relief volunteers from various organizations are being sent to every corner of the island, including hospitals, shelters, and elderly homes. Volunteers coming from afar, not familiar with Puerto Rico may need map data to navigate a post hurricane disaster zone where street signage may have been blown by the fierce winds.
So one can imagine a repeating story playing out in Puerto Rico. That of an elderly person living in the mountainous region of the island, who may be alone, without power, enduring sweltering heat, with no clean water and in need. Yet thanks to a someone in another part of the world who drew a simple outline of his house, a relief worker knows that there is a home there, how to get there and a knock on the door can happen.
You can help Puerto Rico and the Virgin Islands in various ways. Participating in a Mapathon, or donating to the Red Cross are some.
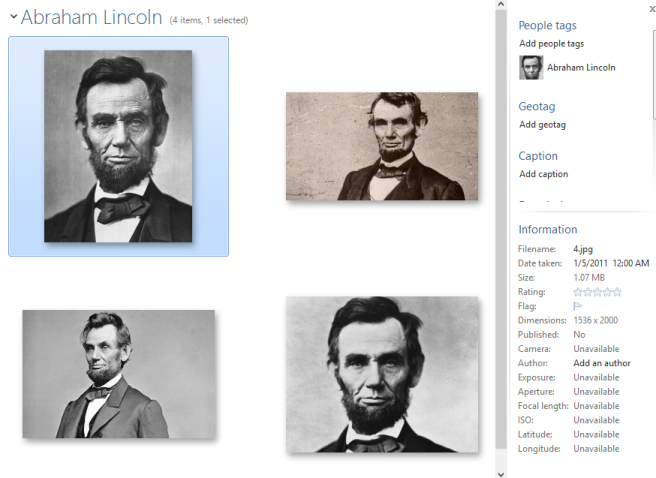
The face information would be saved back to the file as XMP metadata using the Microsoft People Tags Schema. This means that the Face recognition information was saved within file instead of being kept seperate in the app’s database. This is a plus for archivists which would like to preserve this information within the file, but also comes with certain privacy issues.
An amazing additional feature is that you could optionally connect your Facebook account to Windows Photo Gallery and upload photos to that social networking service from the app. Windows Photo Gallery would maintain a link from the photos on your PC to the copy in Facebook. If any of the faces in the uploaded photos were tagged in Facebook by you or others, it would be then also tagged back to the original photo on your PC via Windows Photo Gallery. In a way, you could leverage Facebook to crowd source your people tagging efforts. Quite useful for class reunions or large family gatherings and you wanted others to do the heavy lifting of identifying people in photos. Sadly, this particular functionality was shut down when Facebook decided to pull the plug on Facebook Connect.
Microsoft’s People Tags can be read by Windows Explorer and some third party applications such as Google’s Picasa, Digikam, Photo Supreme, Photo Station, GeoSetter . The People Tags schema never gained much support with other photo organizing apps as many opted to use the more industry accepted Metadata Working Group Face Regions schema, which interestingly Microsoft worked on as well, but never embraced it in Windows.
There are various options to storing People/Face information, either by storing within the file metadata or in an external file or database. I will try to highlight some these options with this post. In all you may have devoted a lot of time in manually including People Tags in your photo collection, so here are some ways to ensure that effort has effort was not in vain. Select the option or options best suited for your workflow.
First things first, as with any file operation which involves modifications, ensure you have backed-up your photos before proceeding.
Exporting People Tag Data to a File
The following command will export the people tag persons displayed names to a tab-delimited file named PeopleTags.txt which can be opened in Microsoft Excel or a database such as Microsoft Access. This is particularly helpful when you wish to create an index or analyse you photos’ metadata fields in ways your photo manager may not be capable of.
In addition to the exiftool executable, you will need to ensure you have the proper exiftool config file for converting mp tags to mwg. The config files extend exiftool functionalities to do other things. In this case, the config file needed is the convert_regions.config which can be obtained in the full Image-ExifTool (.tar.gz) distribution or downloaded from here. A forum discussion thread on the subject can be found here.
The command to use to convert Microsoft People (MP) Tags to Metadata Working Group (MWG) Regions is:
For Face Regions to be displayed in Adobe Lightroom, the MWG Face region name needs to be accompanied by a keyword. As far as I know, this is not mentioned in the MWG spec, but it is a quirk in Lightroom. To accomplish this you can use the following command. Also, as keywords/tags are read by many photo management applications this is a good way to make person’s names available, or when uploading files to a site such as Flickr which reads this information and adds them as tags to the photo.
Recently I came across Tag That Photo, which is a Windows desktop application which has a face detection and recognition functionality similar to Windows Photo Gallery’s. It can read Microsoft People Tags as well as MWG Face regions. The fully licensed version writes face metadata back to the file as MWG Face Regions. The app seems like a good option to support other photo management apps which read MWG by providing a decent face recognition engine.